How Do You Know If a Robot Is Getting Better?
How do you know if you're making progress?
It's a question we keep coming back to. You fine-tune a policy, run it, the arm picks a few things out of a bin. Is it better than last week's checkpoint? Better than the model down the hall? Robotics usually answers with one number, the success rate, and it never sat right with us. Our new paper, PhAIL: A Real-Robot VLA Benchmark and Distributional Methodology, is our attempt to do better.
One number isn't enough
A lot of vision-language-action papers report success rates on 10 to 25 rollouts per task. That isn't a measurement, it's an anecdote. The gap between 47% and 53% over 20 tries is a coin flip you happened to win, and if you can't tell signal from noise, you can't tell whether last month's idea actually helped.
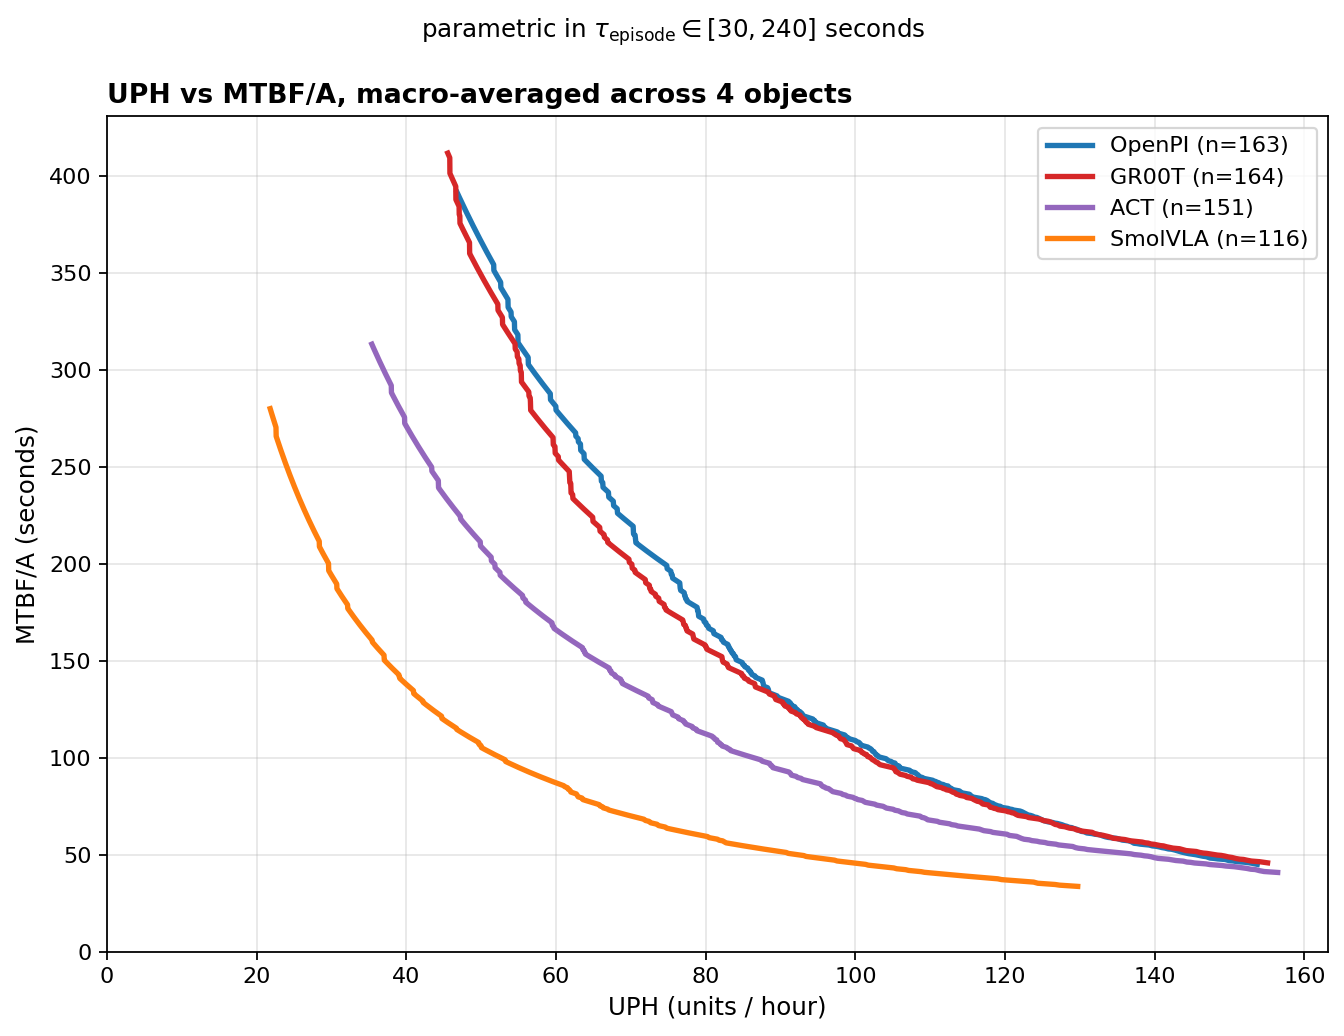
Think about where robots have to earn their keep: a line running the same operation a thousand times a shift. There you care about two things, not one. Does it work, and how fast. Reliability and speed.
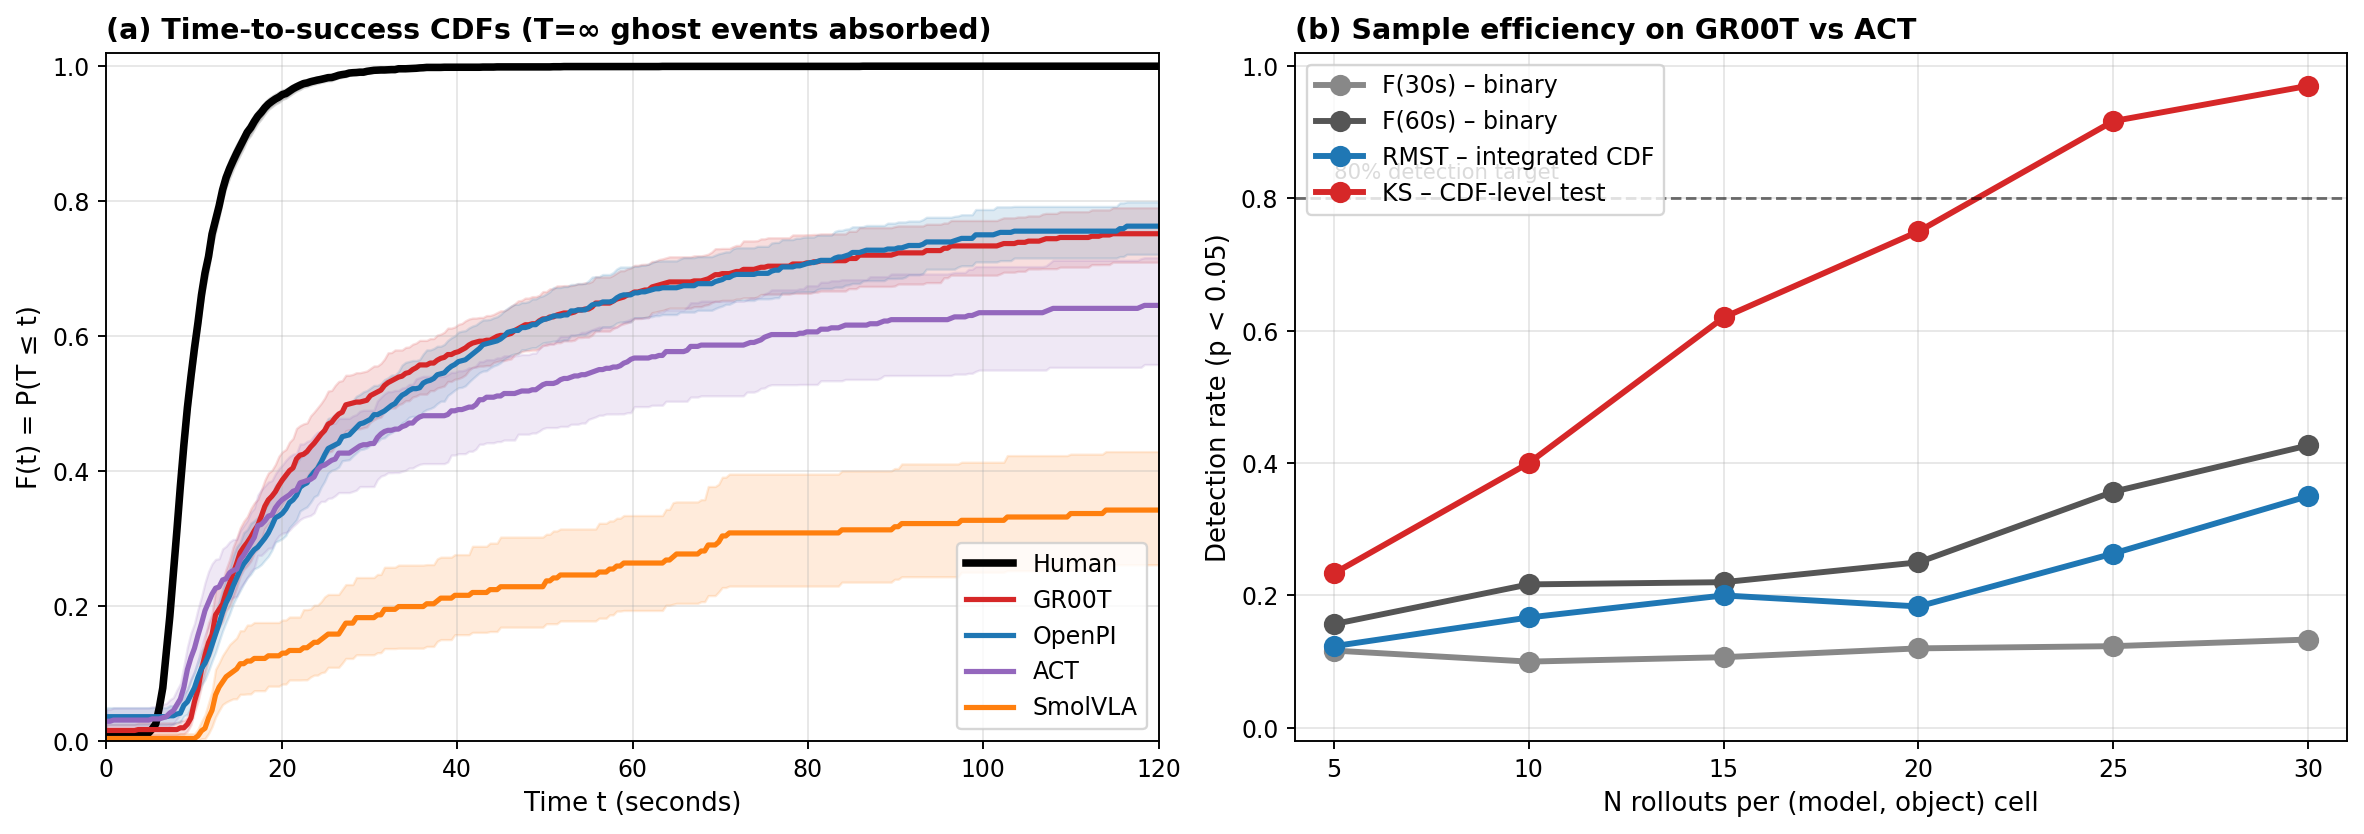
A success rate only answers the first. A robot that slowly but perfectly picks five items and one that fast-picks five while fumbling two can post the same score. The number can't tell them apart.
Report throughput too and you just surface the real problem. Every metric like this is a projection: it squashes a model's whole behavior into one number and throws the rest away. And different projections disagree. On our own data the "best" model changes with the metric you pick: standard success rate crowns one, human-relative throughput a second, a beat-the-human race a third. Same robots, same runs, three different champions.
Work with the distribution
If every scalar is a lossy slice, stop taking slices. Keep the whole thing: the distribution of how long each pick takes.
One curve carries both axes. How fast it rises is speed; how high it plateaus is reliability, because the gap to the top is the failure rate. And it tells the honest story at a glance: the human line jumps straight to the top, while the best model we tested is about seven times slower and never gets there.

Progress means detecting a real difference between two models, and comparing whole distributions finds differences a success rate can't, about 30 times more cheaply. It separates close models in tens of rollouts where a success-rate test would need hundreds. The information was always in your runs; the scalar threw it out before you looked. The bottleneck was never the size of your robot farm. It was the ruler.
Our two closest models came back statistically indistinguishable even at our sample size, so that's what we report, instead of crowning whoever won by half a point. "We can't resolve these yet" is a real result, and a more useful one than a fake winner.
That's what PhAIL is. Not a scoreboard built to crown a champion, but our attempt to answer honestly whether we're making progress. We work with distributions, not scalars, because that's the only way the answer means anything.
- Read the paper: arXiv:2605.29710
- Live results and every recorded run: phail.ai
- Think your model can do better? Submit a checkpoint